South African businesses seldom exploit it, but Google Earth can be a powerful data visualisation tool that significantly enriches business intelligence (BI).
And it's free, says Cor Winckler, technical director of PBT Group.
Winckler has been experimenting with the possibilities presented by Google Earth since the tool was introduced some years ago. He is excited by its potential, and has discovered numerous ways to integrate business data into the mapping tool to deliver valuable business insights.
"If there's any geographic element to the data at all, you can incorporate it into Google Earth to track and measure anything you like. The sky is the limit," he says.
Winckler says, unlike location-based tools now being integrated into major BI software offerings, Google Earth is free. Making use of Google Earth to visualise company data requires nothing more than the time of a programmer, and access to suitable data, he says.
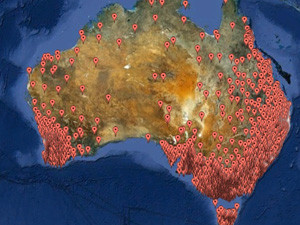
With Google Earth's keyhole mark-up language - KML - anyone capable of writing a program to generate a text file can quickly learn to add data to pinpoints or entire regions on a map. The data you choose to add is up to you, but it could extend to tracking sales activations, deliveries or problem areas.
Integrating a range of data
Data from numerous sources can be added to the same map very simply, adds Winckler, allowing a business to visualise a number of parameters without having to first integrate data from disparate systems. "So you might map sales in a geographic area over a period of time, or in response to an advert, for example," he says.
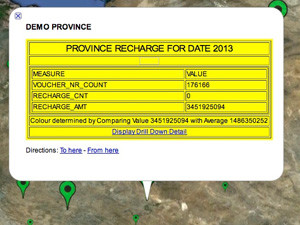
Winckler says a particularly useful function is the playback tool, where data recorded over a period of time can be viewed in playback mode to see changes in the data.
"Visualising data as it changes, in graphic format on a map, makes it come alive," he says. "It makes it more understandable, intuitive, and may even allow you to identify patterns you may not have noticed on a spreadsheet."
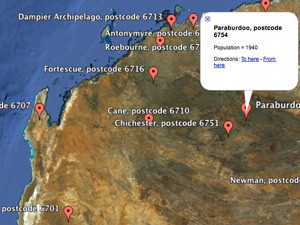
In addition, Google Earth has the advantage of including external data, such as information and photographs of nearby businesses, facilities or infrastructure. This can be used to enhance the enterprise's understanding of the environment it is monitoring on the map.
"The more strategic your role in the enterprise, the more you may want to access information from external sources about the environment," adds Winckler.
Another advantage of using Google Earth is that files can be cached and viewed offline. They are also automatically private, since they exist only on the user's PC, and are therefore not shared with other Google Earth users.
A downside is that data is not updated automatically, so the enterprise has to continually update the data it is viewing, in order to keep it up to date."It's not dynamic - you may have to create a process in the background to generate a new file every day in order to update it. Also, you must have co-ordinates in order to geocode the data. Sourcing the co-ordinates is not difficult, but can be time-consuming at first.
"But eventually, once the initial co-ordinates have been added, the process of updating data and creating reports becomes quick and relatively easy," says Winckler.
"You could even add data from an Excel spreadsheet, although I wouldn't recommend it, since it would be time-consuming."
A self-confessed 'techie at heart', Winckler is keen to see enterprises benefiting from the potential of Google Earth as a BI tool. "It's a bit addictive. You can get lost viewing and adding more and more data," he says.
"Enterprises can benefit from it with very little time and effort. They might use it as a proof-of-concept before moving on to purchase a BI tool that incorporates geolocation functionality. Or they might decide to simply use Google Earth on top of their existing BI tools."
Winckler will discuss Google Earth as a BI tool, and demonstrate how to use it, at ITWeb's annual BI Summit, from 26 to 28 February. For more information about this event, click here.
Share