Cape Town residents can now check how much water they and their neighbours are using each month, after the City of Cape Town launched a water map to assist in water usage tracking.
"Our water map marks residential properties using less than 10 500 litres per month with green dots. The map is a transparent tool and will assist in actively managing and reducing consumption to avoid Day Zero," the city said in a statement.
Ongoing drought has severely reduced stream flows into the dams of the Western Cape water supply scheme, and as a result, the city is now preparing for Day Zero, when most taps will be turned off and residents will have to queue for water at collection sites across the city.
"The greener we go, the more we push Day Zero away. The map shows that many households across Cape Town are working hard to save water as part of the effort to get us through our worst drought," says City of Cape Town executive mayor Patricia de Lille.
By making consumption information available, the city believes it will assist residents and communities to better manage their water consumption.
"It has been found that high [usage] consumers are often unaware of their consumption but are willing to change their behaviour once approached."
Day Zero
![Cape Town executive mayor Patricia de Lille. [Photo source: WEF]](https://www.itweb.co.za/static/pictures/2017/11/resized/-fs-Patricia-de-Lille-2017.xl.jpg)
The city says Day Zero will come when dam levels reach 13.5%, which is estimated to be on 22 April.
According to the mayor, only about 54% of the city's consumers are saving water to avoid the fast approaching day.
"We need absolutely everyone to come on board because the prospect of queuing daily for an allocation of 25 litres per person is a reality and we must do more to avoid it at all cost," says De Lille.
The city is also working on different solutions to deliver additional water from groundwater, desalination and water reuse sources, but has been heavily criticised for not finding workable solutions before the water situation became a crisis.
"It is crucial for everyone to play their part. The city will continue with extensive enforcement but it is not possible to police consumption at every household. If we do not change our behaviour more, we are likely to face Day Zero," De Lille added.
Mapping consumption
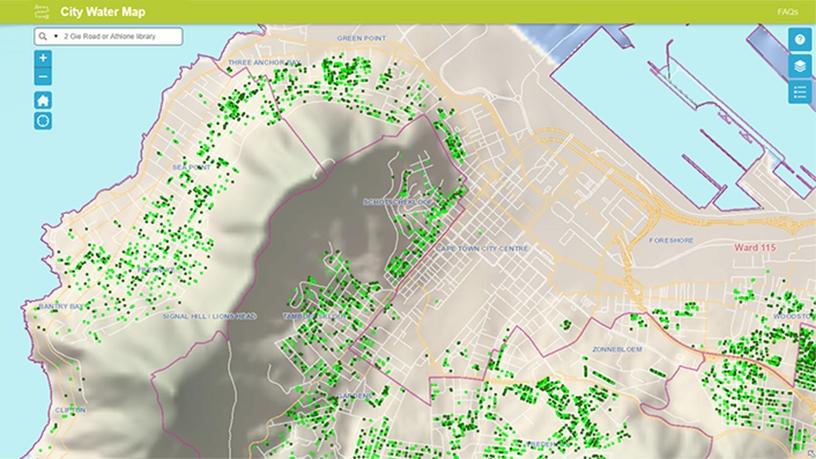
On the online map, consumption of water per household is indicated via dots: a dark green dot shows a household using less than 6 000 litres per month; a light green dot indicates a household using between 6 000 and 10 500 litres per month; no dot is shown when a household is using more than 10 500 litres per month; and a grey dot is shown when a water meter is not read for some reason, or if no information is available for the property.
You can zoom in on an area to see the usage per house on a given street, or look for a specific address by searching in the search bar on the map Web site.
The map, however, only shows consumption for free-standing houses and not cluster housing, flats or other land uses. The data is also delayed. The map shows consumption for the previous month and is updated around the third week of the following month. For example, January consumption information will be available in the third week of February. At the moment, the map is still showing data for November but December data is expected this week.
Water restrictions mean residents are only supposed to use 87 litres of water per person per day, which works out to 2 600 litres of water per person per month.
"Households with higher consumption may have many people living on the property or may have an undetected water leak. The city continues its interventions with these users," notes De Lille.
Critical stage
The city says it is in a "critical stage" and water consumption remains too high for too many homes. The residential sector uses approximately 65% of water allocation and the city believes this sector "holds the key to helping the city avoid Day Zero".
"Neighbourhoods should have constructive engagements with one another to ensure their neighbourhood is painted green. Mobilise groups in your area in order to collectively manage water consumption," suggested the mayor.
De Lille said the monthly consumption for a four-person household, all using a maximum of 87 litres per person per day, should be less than 10 500 litres (ie, a light green dot). A two-person household should have consumption of less than 5 300 litres (ie, a dark green dot).
Consumption higher than 10 500 litres per month (no green dot) does not, however, necessarily indicate water abuse. The city says other legitimate reasons for this could be: a high number of occupants or guests in the house; water leaks that the occupants are unaware of (this happens frequently); the operation of a home business or B&B on the property; or recently completed building work.
The table below provides a guide to how much water a household should be using based on the number of occupants.
Number of occupants | Litres per day | Approximate litres per month per household |
1 | 87 | 2 600 |
2 | 174 | 5 300 |
3 | 261 | 7 900 |
4 | 348 | 10 500 |
5 | 435 | 13 200 |
6 | 522 | 15 900 |
7 | 609 | 18 500 |
8 | 696 | 21 200 |
The city says that as most people also consume water at work, school, gym or elsewhere, household consumption should be lower than the maximum amount indicated in the table.
Share