
South Africa's smartphone penetration has nearly doubled in the last two years and is now sitting at over 80%.
This is according to the Independent Communications Authority of South Africa's (ICASA's) new report on the State of ICT Sector in SA 2019, which specifically looks at telecommunications, broadcasting and postal services.
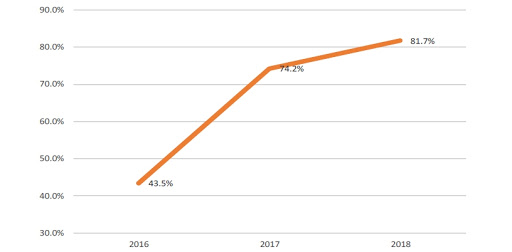
The ICASA report found SA's smartphone* penetration was 81.72% as at the end of September 2018, compared to 43.5% in September 2016 and 74.2% in September 2017. ICASA recorded smartphone subscriptions at 46.9 million as at 30 September 2018.
This figure needs to be taken in the context that SA's population was estimated at 57.7 million as at 1 July 2018, according to Statistics South Africa's mid-year population estimates report for 2018.
The penetration rate likely reflects that many South Africans have more than one smartphone, while a significant portion of citizens are still reliant on basic or feature phones. ICASA did not publish feature phone penetration rates.
However, a study from the Pew Research Centre, published in October 2018, found SA's smartphone penetration was 51%. The research showed 40% of South Africans had basic phones, such as flip phones or feature phones, and 9% had no phone at all.
According to StatsSA's latest General Household Survey, the proportion of households that use only cellphones as a means of communication steadily increased from 85.5% in 2015, to 87% in 2016 and reached 88.2% in 2017.
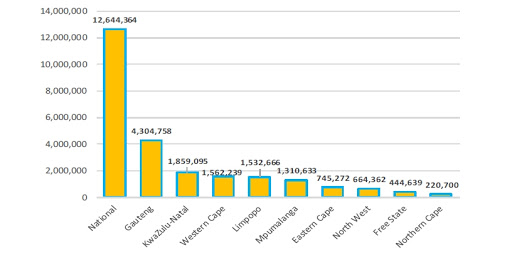
According to ICASA, the total number of 4G/LTE device subscribers in SA in 2018 was over 12.6 million. Gauteng had the highest LTE devices at 4.3 million, followed by KwaZulu-Natal with almost 1.9 million and the Western Cape with almost 1.6 million. Meanwhile, the province with the lowest number of LTE devices was the Northern Cape, where there were only 220 700 in 2018.
Mobile subscriptions
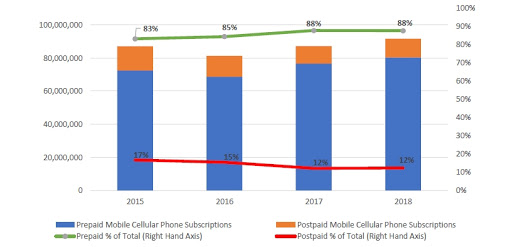
Total mobile cellphone voice subscriptions increased by 5.2% from 87.2 million in 2017, to 91.7 million in 2018. This figure must once again be taken in the context that SA's population is around 57.7 million.
According to ICASA, of the 91.7 million cellphone voice subscriptions in 2018, 88% or 80.4 million were prepaid subscriptions, and 12%, or 11.2 million, were postpaid subscriptions.
Since 2015, the total number of mobile voice subscriptions slightly increased by 1.8%. Prepaid cellular subscriptions slightly increased by 3.6%, and postpaid cellular subscriptions decreased by 8.2% over the four-year period.
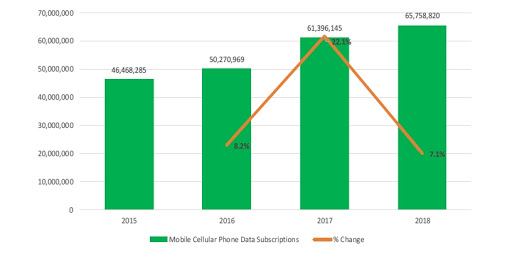
In terms of mobile data subscriptions, ICASA recorded an increase of 7.1% from 61.4 million in 2017 to 65.8 million in 2018. Over the four-year period from 2015 to 2018, mobile data subscriptions increased by 12.3%.
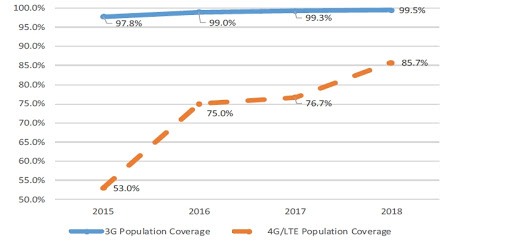
The ICASA report shows SA's national population coverage for 3G remained stable at 99.5% in 2018. National population coverage for 4G/LTE increased from 76.7% in 2017 to 85.7% in 2018.
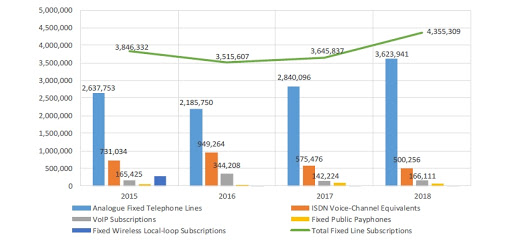
Although fixed-line usage has been on the decline for years, ICASA's report shows a 19.5% increase in the total number of fixed-line subscriptions in SA from 3.6 million in 2017 to 4.3 million in 2018.
In 2018, analogue fixed-telephone lines increased by 27.6%, ISDN voice-channel equivalents decreased by 13.1%, VOIP subscriptions increased by 16.8%, fixed public payphones significantly decreased by 26.1% and fixed wireless local loop subscriptions also significantly decreased by 27.6%.
Over a four-year period, the total number of fixed-line subscriptions increased by 4.2%.
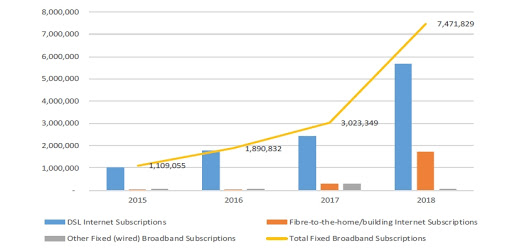
The number of people with access to broadband connections has jumped massively over the last year. According to ICASA, the total number of fixed broadband subscriptions increased by 147.1% from 3 million in 2017 to 7.4 million in 2018.
"This jump in subscriptions was mainly as a result of significant increase in DSL and FTTH [fibre-to-the-home] and FTTB [fibre-to-the-business] subscriptions, which grew at 133% and 517.7% respectively."
For the four-year period, fixed broadband subscriptions increased significantly by 88.9%. Over the same period, DSL Internet subscriptions increased by 77.6%, FTTH/building Internet subscriptions increased by 278.8%, and other fixed (wired) broadband subscriptions increased by 3%.
Machine-to-machine (M2M) mobile-network subscriptions also increased by 18.7% from 5.8 million in 2017 to 6.9 million in 2018. Over a period of four years, M2M mobile subscriptions increased by 16.5%.
Traffic volumes
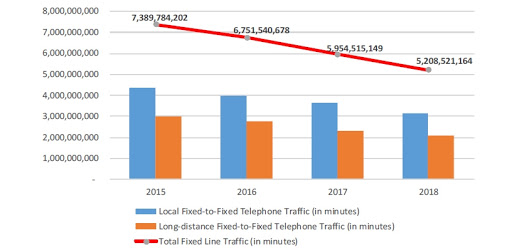
ICASA found total fixed-line traffic (local and long distance) decreased by 12.5% from 5.9 billion minutes in 2017 to 5.2 billion minutes in 2018. The volume of fixed-line traffic has consistently declined over the four-year period.
Fixed-to-mobile telephone call traffic decreased by 8.1% in 2018; however, there was an increase of 23% over a period of four years.
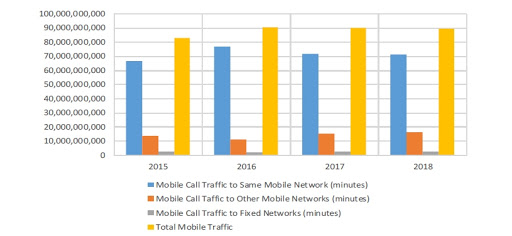
In terms of mobile voice traffic, after a slight increase in the total voice cellphone traffic in 2016, the volumes have remained stable at roughly 90 billion minutes.
On-net calls to the same network have remained dominant at around 71 billion minutes, with off-net call volumes to other mobile networks a far second at around 16 billion minutes and mobile voice calls to fixed-line networks remaining low throughout the period.
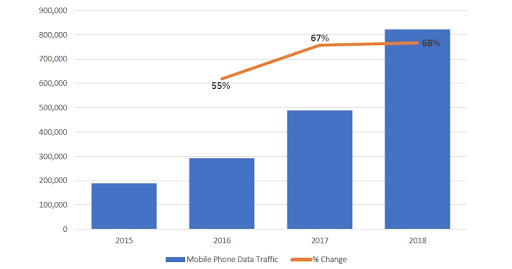
Mobile data traffic in terabytes has shown strong growth over the past four years, increasing by 55% in 2016, 67% in 2017 and 68% in 2018.
* ICASA defines a smartphone as "a mobile phone with advanced features: it has WiFi connectivity, Web browsing capabilities, a high-resolution touch-screen display and the ability to use apps".
** All graphs sourced from the ICASA Electronic Communications Questionnaire 2018.
Share