Telecoms operator MTN has lost market share in several key markets over the past five years, including South Africa and Nigeria.
This is according to the group's five-year review document published as part of its integrated report for the year ended 31 December 2017.
In SA, MTN's market share has dropped by a compound annual growth rate (CAGR) of 3% between 2013 and 2017. In 2013, MTN had 35% market share; this dropped slightly to 34% in 2014 and 2015, and then grew to 36% in 2016 before dropping down to 31% in 2017.
In Nigeria, MTN's biggest market, its market share was as high as 49% in 2013 and 2014 but by 2017 had fallen to 42%. In another key market, Iran, the group's market share has been relatively stable, fluctuating marginally between 46% and 47% between 2013 and 2017. Cameroon, Ivory Coast and Syria have also seen declines over the five-year period.
However, some markets are gaining market share, including Ghana, which grew from 50% market share in 2013 to 55% by the end of 2017. Uganda gained ground from 54% in 2013 to 56% in 2017 and Sudan also ticked up from 34% in 2013 to 35% five years later.
MTN market share (%) per country
Country | 2017 | 2016 | 2015 | 2014 | 2013 |
South Africa | 31% | 36% | 34% | 34% | 35% |
Nigeria | 42% | 48% | 45% | 49% | 49% |
Iran | 46% | 46% | 47% | 46% | 47% |
Cameroon | 54% | 57% | 56% | 59% | 59% |
Ivory Coast | 34% | 33% | 32% | 39% | 38% |
Syria | 41% | 45% | 42% | 44% | 44% |
Ghana | 55% | 56% | 52% | 51% | 50% |
Uganda | 56% | 53% | 51% | 57% | 54% |
Sudan | 35% | 35% | 34% | 36% | 34% |
MTN says it has the largest market share in 14 out of the 22 countries it operates in; down slightly from being number one in 15 countries between 2013 and 2016.
The five-year review reveals headline earnings for the group have been falling by a CAGR of 40% over the past five years. In 2013, MTN's headline earnings were almost R25.9 billion; this amount rose to R28.2 billion in 2014, then down to R13.6 billion in 2015. A year later, the group saw a headline loss of R1.4 billion before swinging back to a profit of close to R3.3 billion in 2017.
The headline loss in 2016 was significantly impacted by the group's regulatory fine in Nigeria. In June 2016, MTN agreed to a settlement amount of 330 billion naira ($1.671 billion at the time) to be paid to the Nigerian government in six instalments over three years. This after it failed to meet a deadline to disconnect 5.1 million unregistered SIM cards on its Nigerian network in 2015.
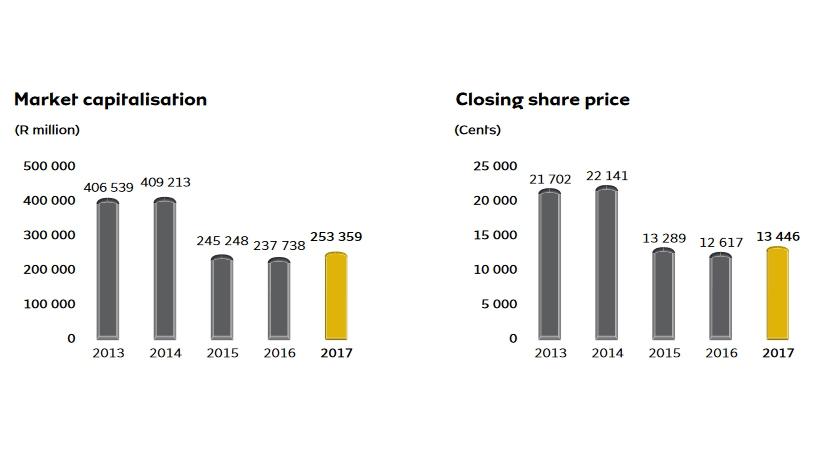
A decline in MTN's share price on the Johannesburg Stock Exchange has seen the group's market capitalisation plummet from R409.5 billion at the end of 2014 to R253.4 billion at the end of 2017.
Subscriber swings
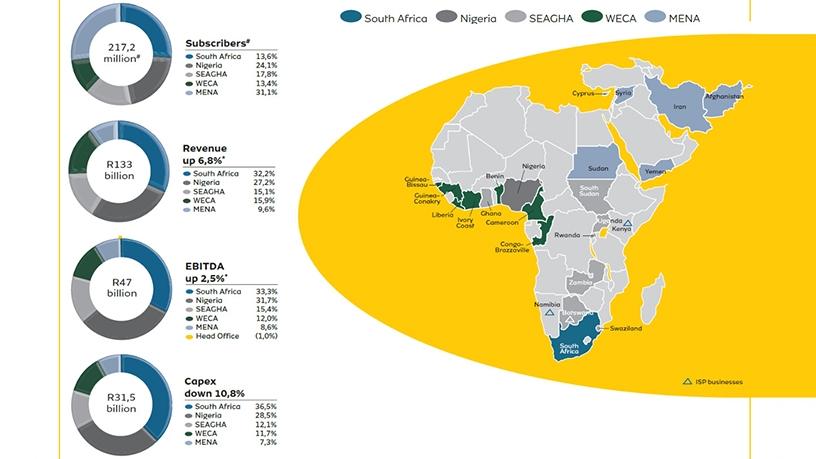
Overall subscriber numbers have fluctuated over the five-year period as well. In 2013, MTN had 207.8 million group subscribers and this grew steadily over the next three years to 240.4 million in 2016. However, the number dropped by over 23 million in 2017 to 217.2 million due to a new initiative to modernise its subscriber definitions implemented last year.
Subscriber numbers (million)
Subscriber numbers (million) | 2017 | 2016 | 2015 | 2014 | 2013 |
Group | 217.2 | 240.4 | 232.5 | 223.3 | 207.8 |
Nigeria | 52 | 62 | 61 | 60 | 57 |
Iran | 43 | 48 | 46 | 44 | 41 |
South Africa | 30 | 31 | 31 | 28 | 26 |
Ghana | 16 | 19 | 16 | 14 | 13 |
Uganda | 11 | 11 | 9 | 10 | 9 |
Ivory Coast | 11 | 9 | 8 | 8 | 7 |
Sudan | 8 | 7 | 8 | 9 | 9 |
Cameroon | 7 | 10 | 9 | 10 | 7 |
Syria | 6 | 6 | 6 | 6 | 6 |
In 2017, Nigeria's subscriber numbers of 52 million made up 24.1% of MTN's overall group subscribers while South Africa's 30 million subscribers were 13.6% of the total. The rest of the countries were broken down on a regional basis. The biggest was the Middle East and North Africa region, which made up 31.1% of total subscribers; Southern and East Africa and Ghana accounted for 17.8% of subscribers and West and Central Africa for 13.4%.
Share