Alphabet's Google is introducing a way for users to instantly visualise data using machine learning in Google Sheets.
Sheets is similar to Microsoft's Excel; however, the document is hosted in Google Drive and can be accessed and edited by multiple people.
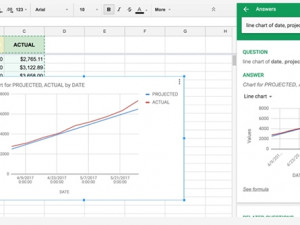
Excel lets users select data in a document and will create a chart by placing the different sets on y and x axis. Google Sheets will now let users ask questions, in words not formulas, and have the data analysed and a graph created.
The question box is accessed through the 'Explore' button at the bottom right of the screen.
Daniel Gundrum, Google product manager, in a blog post says: "For example, you can ask 'what is the distribution of products sold?' or 'what are average sales on Sundays?' and Explore will help you find the answers."
There will be a number of charts on display, and Gundrum says, if the user is looking for a more specific one, they just need to ask.
"Instead of manually building charts, ask Explore to do it by typing in 'histogram of 2017 customer ratings' or 'bar chart for ice-cream sales'. Less time spent building charts means more time acting on new insights."
The company has also introduced other new updates to Sheets, including being able to instantly sync data from Sheets with Google Docs or Slides, new keyboard shortcuts, an upgraded print preview, and new spreadsheet functions.
All new features will roll out this week.
Share