
RavenPack, a Spanish consultancy that specialises in big data analytics for financial services, has debuted a coronavirus dashboard designed to inform data-driven business insights.
CEO and founder Armando Gonzalez says clients requested a dashboard to help them make decisions in this time of uncertainty in financial markets.
The monitor uses a natural language processing aggregator with other coronavirus indexes. It tracks the ‘panic index’, fake news, media hype and public sentiment globally and regionally. Gonzalez says most people are interested in the panic index.
Lockdown extension causes panic
It shows that 3.3% of all global news reference the words ‘panic’ or ‘hysteria’. The local panic index currently sits at 3.7%, much lower than its 17% peak on March 30, a week after President Cyril Ramaphosa announced the national lockdown.
The dashboard also has a table ranking coronavirus-related topics such as ‘second wave’, ‘mental health’ and ‘war’, where the percentage indicates the number of news stories mentioning the topic and the virus.
According to the table, ‘remote education’, ‘state of emergency’ and ‘death toll climbing’ are among SA’s most mentioned topics alongside the virus.
“As a company that specialises in news and social media content analysis, we had to play to our strengths and build an engine that tracks public sentiment and media coverage around the virus,” sasy Gonzalez.
The seven-man team behind the platform includes data scientists, graphic designers and software developers.
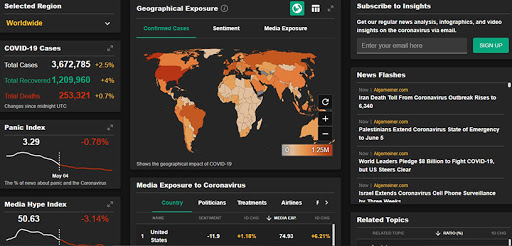
The dashboard, which is free to use, shows an interactive world map showing coronavirus statistics for each country, such as total cases, recoveries, and fatalities. RavenPack uses its own data as well as data from Worldometers and Johns Hopkins University to track cases.
Lasting effects
Gonzalez says the dashboard’s typical use cases include risk management for large pension funds and investors with assets in different countries. The analytics track people’s perceptions around entities and also allows the comparison of data.
The monitor’s real-time newsfeed gathers headlines from over 19 000 verified news sources. Source verification depends on the publications’ readership levels, reputation and writing style. The algorithm searches for stories with a reference to COVID-19 and its different names, which are then indexed.
All other indexes are refreshed hourly. The contagion index measures the percentage of entities (people, companies, places) co-mentioned with the virus. At the time of writing, the global index sits at 65%.
“This means 65% of everything that affects our world today is linked to COVID-19; it’s infecting all sorts of actors in society and from an economic perspective, this tells us the effects of the virus will be with us for the long haul,” says Gonzalez. SA’s contagion index sits at 85%.
According to the dashboard, Donald Trump is the political figure most mentioned alongside coronavirus in the world; while Facebook and Apple top the tech services and technology co-mentions respectively.
The dashboard can be viewed here.
Share