The amount of data being generated each year by people, machines, IOT devices and other sources is growing exponentially. However, data on its own doesn't provide decision-makers with valuable insights in isolation. It needs to be collected, organised and analysed to provide any meaningful value.
The speed at which businesses can access, interpret and act on their data can be a competitive differentiator. This is where data visualisation tools and techniques that enable businesses to see the connections between multi-dimensional data sets and interpret data through the use of various graphic representations come in. These tools and techniques help to significantly improve a business's' ability to grasp information hiding in its data.
Unravelling data
"Data visualisation not only helps unravel an organisation's data, it makes it easier to understand, and helps to democratise it within the organisation. It also improves accuracy when making strategic predictions through data visualisation and artificial intelligence."
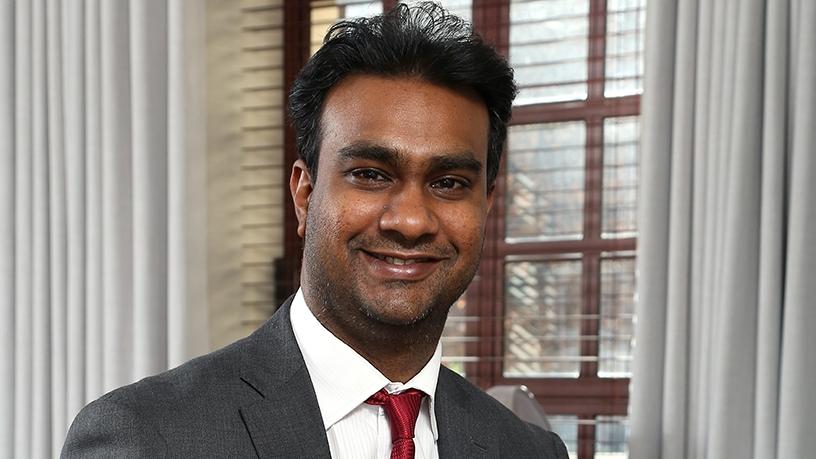
This is according to Aneshan Ramaloo, advanced analytics practice lead at SAS Africa, who will be presenting on 'Solving business problems using data visual visualisation and machine learning', at the ITWeb Business Intelligence & Analytics Summit 2018, to be held on 14 and 15 March at The Forum in Bryanston.
ITWeb BI & Analytics Summit 2018
Register now to attend the BI & Analytics Summit 2018 at The Forum, Bryanston on 13 - 15 March 2018. Aneshan Ramaloo will join other industry leaders in discussing their experience of the best practices for business intelligence and analytics. For the most up-to-date agenda, click here.
To find out more and register for the ITWebBI & Analytics Summit 2018, go to: http://v2.itweb.co.za/event/itweb/business-intelligence-summit-2018/?page=agendaday1
Speaking of how data visualisation and machine learning can be used to solve business problems, he says: "For me, it's all about how we process data. Humans are hardwired to see patterns and connect the dots as opposed to reading numbers off a table. Therefore, visualising data helps us understand the insights from the data and to ultimately making data-driven decisions."
Machine learning can help businesses solve a wide variety of problems, including fraud detection, credit scoring for risk-based decisioning, and prediction of equipment failures, he says. "It can also help with text-based sentiment analysis from customers on series and products, as well as pattern and image recognition."
In terms of what businesses could be doing more effectively in terms of data visualisation and machine learning, Ramaloo says they should continuously ensure that their people are upskilled and mastering how they work with data. "From simple reporting to more advanced analytics, the point is to do it better."
Delegates attending Ramaloo's talk will gain a better understanding of data visualisation and machine learning, and the value these tools bring. "Delegates will be able to start thinking how they can incorporate it into their organisations."
Share