For the fourth consecutive year, Amaury Sport Organisation (ASO), organiser of the Tour de France, has partnered with Dimension Data to help engage a new generation of young fans.
In 2015, Dimension Data become the official technology partner of the Tour de France, and created a five-year roadmap for digitally transforming the experience for audiences around the world.
Scott Gibson, group executive for digital practice at Dimension Data, says: "If you look at the sport of cycling, and in the same way that any other customer of ours, the environment they are in is being disrupted. There are new players coming into the market and the customer of today is expecting a different experience.
"The audiences of today were also going through that same mind shift change, when it came to watching cycling. And so the ASO came to us, and when we sat down and workshopped with them, we said to them, well let's build a five-year road-map around how we can digitally transform the Tour de France.
"In 2015, we started at a very basic level, just tracking the actual cyclist: live speeds, live positions, live gaps between riders. It was simple but it allowed the event to move from solely relying on commentators having to talk about the gaps and speeds, to having it visually displayed."
Previously, audiences relied on commentators to talk about this information. Gibson says commentators in turn relied on people who were riding in the back or on a motor bike to measure the speed of a particular rider, write it on a chalk board and hold it up. The commentators still had to wait for the camera to show that person before they could know the speed.
Beyond the human brain
By the end of this year's Tour de France, over 150 million data points will have been captured. This is achieved through a real-time, big data analytics platform that sucks in all the data points, sorts them out and produces insights.
"Whilst we understand that the project is about cycling and the cycling fan, what we are also trying to do is showcase technology that we can apply at all of our other customers, whether they be in retail, mining or manufacturing," says Gibson.
"So we have had to be quite strict about what we do innovate around, as every year we try innovate and do something new, because we don't want to just do something that we think has no real use in any other industry.
"For us, this has also been quite an interesting R&D project; a lot of our innovations are actually trialled at the Tour de France."
Over the last four years, Dimension Data has incorporated machine learning to make predictions about race outcomes, and this year it is trialling new cyber security technology (the results of which will be shared after the race).
Last year, the company tested a machine learning program which predicted where riders would place, with 70% to 74% accuracy. Gibson says machine learning is a massive play in every vertical at the moment, and industries that don't incorporate it will be left behind. He notes that 100% accuracy is not required; it just gives businesses the capacity to think beyond the human brain and point out blind spots.
Moving network
"The Tour de France is a complex event. It is not based in a stadium, so the logistical challenges involved are significant.
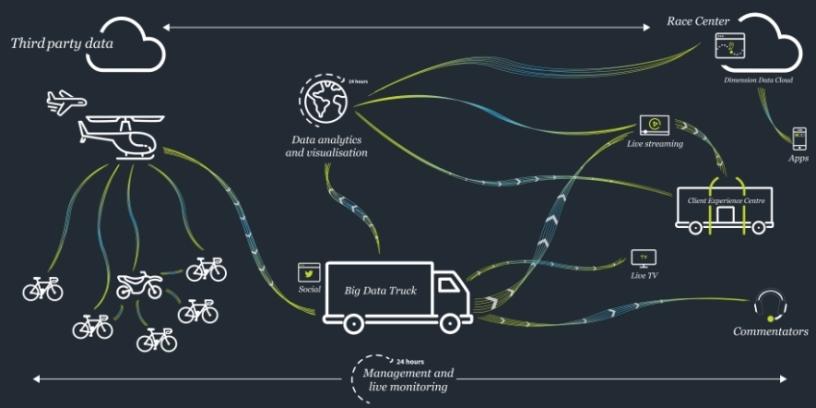
"We couldn't do it with GSM because that only gave us positions every three seconds and we needed it more accurate than that. We needed an every second position from every rider. So we built a radio network; we have receivers that sit on the back of every bike. We built receiving devices inside the TV vehicles and motorbikes that travel around with the peloton.
"That piggybacks off the television signal which goes first into the helicopter, then it goes to a fixed wing aircraft that is circling the race and that fixed wing aircraft is in line of sight to a cherry-picker that sits at the finish line for that day and receives the data there. We then take that data and put it straight into the cloud where we run a lot of the data analytics.
"In 2015, we did this all out of our moving big data truck; we then virtualised it and did it half-half, we now do it all in the cloud.
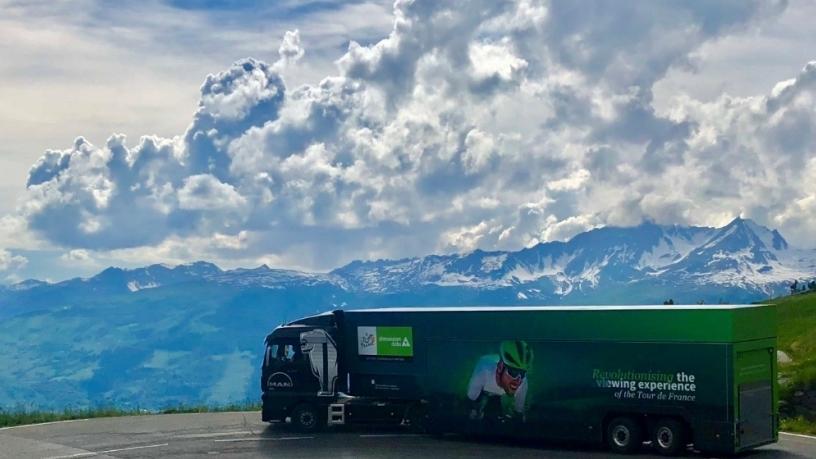
"We still have a big data truck but it is more now sort of a control centre and a place for us to give support to commentators who are using our data."
To run this operation, Gibson says the company has teams all over the world, which is made possible by crunching all the data in the cloud. In Johannesburg, at the Dimension Data campus, there is a team running the Race Centre, which is Web site where all the data is being collected. In London there is an analytics team, and there is someone in San Francisco running the databases.
Attracting over 9.1 million visitors each year, the Race Centre platform enables fans to track the position and speed of their favourite cyclist in real-time. They can also access the real-time effects of variables such as route terrain and weather conditions, and be privy to highly accurate predictions such as stage favourites, the estimated time of arrival at key points in the race, and when the peloton is likely to catch the breakaway group.
Some results from previous years include a 15% year-on-year increase in Web site traffic, and Tour de France online video views have risen from six million in 2014 to 71 million in 2017.
The 105th edition of the Tour de France will draw to an end on Sunday, 29 July.
Share